Here’s my (rather verbose) response to the three most design-related questions in DECC’s smart meter consultation that I mentioned earlier today. Please do get involved in the discussion that Jamie Young’s started on the Design & Behaviour group and on his blog at the RSA.
Q12 Do you agree with the Government’s position that a standalone display should be provided with a smart meter?
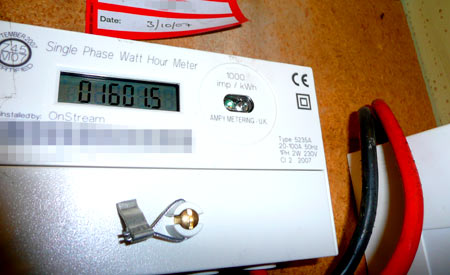
Free-standing displays (presumably wirelessly connected to the meter itself, as proposed in [7, p.16]) could be an effective way of bringing the meter ‘out of the cupboard‘, making an information flow visible which was previously hidden. As Donella Meadows put it when comparing electricity meter placements [1, pp. 14-15] this provides a new feedback loop, “delivering information to a place where it wasn’t going before” and thus allowing consumers to modify their behaviour in response.
“An accessible display device connected to the meter” [2, p.8] or “series of modules connected to a meter” [3, p. 28] would be preferable to something where an extra step has to be taken for a consumer to access the data, such as only having a TV or internet interface for the information, but as noted [3, p.31] “flexibility for information to be provided through other formats (for example through the internet, TV) in addition to the provision of a display” via an open API, publicly documented, would be the ideal situation. Interesting ‘energy dashboard’ TV interfaces have been trialled in projects such as live|work‘s Low Carb Lane [6], and offer the potential for interactivity and extra information display supported by the digital television platform, but it would be a mistake to rely on this solely (even if simply because it will necessarily interfere with the primary reason that people have a television).
The question suggests that a single display unit would be provided with each meter, presumably with the householder free to position it wherever he or she likes (perhaps a unit with interchangeable provision for a support stand, a magnet to allow positioning on a refrigerator, a sucker for use on a window and hook to allow hanging up on the wall would be ideal – the location of the display could be important, as noted [4, p. 49]) but the ability to connect multiple display units would certainly afford more possibilities for consumer engagement with the information displayed as well as reducing the likelihood of a display unit being mislaid. For example, in shared accommodation where there are multiple residents all of whom are expected to contribute to a communal electricity bill, each person being aware of others’ energy use (as in, for example, the Watt Watchers project [5]) could have an important social proof effect among peers.
Open APIs and data standards would permit ranges of aftermarket energy displays to be produced, ranging from simple readouts (or even pager-style alerters) to devices and kits which could allow consumers to perform more complex analysis of their data (along the lines of the user-led innovative uses of the Current Cost, for example [8]) – another route to having multiple displays per household.
Q13 Do you have any comments on what sort of data should be provided to consumers as a minimum to help them best act to save energy (e.g. information on energy use, money, CO2 etc)?
Low targets?
This really is the central question of the whole project, since the fundamental assumption throughout is that provision of this information will “empower consumers” and thereby “change our energy habits” [3, p.13]. It is assumed that feedback, including real-time feedback, on electricity usage will lead to behaviour change: “Smart metering will provide consumers with tools with which to manage their energy consumption, enabling them to take greater personal responsibility for the environmental impacts of their own behaviour” [4, p.46]; “Access to the consumption data in real time provided by smart meters will provide consumers with the information they need to take informed action to save energy and carbon” [3, p.31].
Nevertheless, with “the predicted energy saving to consumers… as low as 2.8%” [4, p.18], the actual effects of the information on consumer behaviour are clearly not considered likely to be especially significant (this figure is more conservative than the 5-15% range identified by Sarah Darby [9]). It would, of course, be interesting to know whether certain types of data or feedback, if provided in the context of a well-designed interface could improve on this rather low figure: given the scale of the proposed roll-out of these meters (every household in the country) and the cost commitment involved, it would seem incredibly short-sighted not to take this opportunity to design and test better feedback displays which can, perhaps, improve significantly on the 2.8% figure.
(Part of the problem with a suggested figure as low as 2.8% is that it makes it much more difficult to defend the claim that the meters will offer consumers “important benefits” [3, p.27]. The benefits to electricity suppliers are clearer, but ‘selling’ the idea of smart meters to the public is, I would suggest, going to be difficult when the supposed benefits are so meagre.)
If we consider the use context of the smart meter from a consumer’s point of view, it should allow us to identify better which aspects are most important. What is a consumer going to do with the information received? How does the feedback loop actually occur in practice? How would this differ with different kinds of information?
Levels of display
Even aside from the actual ‘units’ debate (money / energy / CO2), there are many possible types and combinations of information that the display could show consumers, but for the purposes of this discussion, I’ll divide them into three levels:
(1) Simple feedback on current (& cumulative) energy use / cost (self-monitoring)
(2) Social / normative feedback on others’ energy use and costs (social proof + self-monitoring)
(3) Feedforward, giving information about the future impacts of behavioural decisions (simulation & feedforward + kairos + self-monitoring)
These are by no means mutually exclusive and I’d assume that any system providing (3) would also include (1), for example.
Nevertheless, it is likely that (1) would be the cheapest, lowest-common-denominator system to roll out to millions of homes, without (2) or (3) included — so if thought isn’t given to these other levels, it may be that (1) is all consumers get.
I’ve done mock-ups of the sort of thing each level might display (of course these are just ideas, and I’m aware that a) I’m not especially skilled in interface design, despite being very interested in it; and b) there’s no real research behind these) in order to have something to visualise / refer to when discussing them.
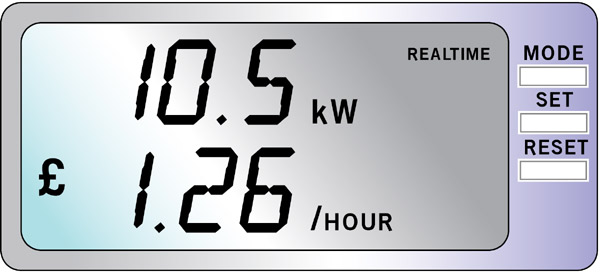
(1) Simple feedback on current (& cumulative) energy use and cost
I’ve tried to express some of the concerns I have over a very simple, cheap implementation of (1) in a scenario, which I’m not claiming to be representative of what will actually happen — but the narrative is intended to address some of the ways this kind of display might be useful (or not) in practice:
Jenny has just had a ‘smart meter’ installed by someone working on behalf of her electricity supplier. It comes with a little display unit that looks a bit like a digital alarm clock. There’s a button to change the display mode to ‘cumulative’ or ‘historic’ but at present it’s set on ‘realtime’: that’s the default setting.
Jenny attaches it to her kitchen fridge with the magnet on the back. It’s 4pm and it’s showing a fairly steady value of 0.5 kW, 6 pence per hour. She opens the fridge to check how much milk is left, and when she closes the door again Jenny notices the figure’s gone up to 0.7 kW but drops again soon after the door’s closed, first to 0.6 kW but then back down to 0.5 kW again after a few minutes. Then her two teenage children, Kim and Laurie arrive home from school — they switch on the TV in the living room and the meter reading shoots up to 0.8 kW, then 1.1 kW suddenly. What’s happened? Jenny’s not sure why it’s changed so much. She walks into the living room and Kim tells her that Laurie’s gone upstairs to play on his computer. So it must be the computer, monitor, etc.
Two hours later, while the family’s sitting down eating dinner (with the TV on in the background), Jenny glances across at the display and sees that it’s still reading 1.1 kW, 13 pence per hour.
“Is your PC still switched on, Laurie?” she asks.
“Yeah, Mum,” he replies
“You should switch it off when you’re not using it; it’s costing us money.”
“But it needs to be on, it’s downloading stuff.”Jenny’s not quite sure how to respond. She can’t argue with Laurie: he knows a lot more than her about computers. The phone rings and Kim puts the TV on standby to reduce the noise while talking. Jenny notices the display reading has gone down slightly to 1.0 kW, 12 pence per hour. She walks over and switches the TV off fully, and sees the reading go down to 0.8 kW.
Later, as it gets dark and lights are switched on all over the house, along with the TV being switched on again, and Kim using a hairdryer after washing her hair, with her stereo on in the background and Laurie back at his computer, Jenny notices (as she loads the tumble dryer) that the display has shot up to 6.5 kW, 78 pence per hour. When the tumble dryer’s switched on, that goes up even further to 8.5 kW, £1.02 per hour. The sight of the £ sign shocks her slightly — can they really be using that much electricity? It seems like the kids are costing her even more than she thought!
But what can she really do about it? She switches off the TV and sees the display go down to 8.2 kW, 98 pence per hour, but the difference seems so slight that she switches it on again — it seems worth 4 pence per hour. She decides to have a cup of tea and boils the kettle that she filled earlier in the day. The display shoots up to 10.5 kW, £1.26 pence per hour. Jenny glances at the display with a pained expression, and settles down to watch TV with her tea. She needs a rest: paying attention to the display has stressed her out quite a lot, and she doesn’t seem to have been able to do anything obvious to save money.
Six months later, although Jenny’s replaced some light bulbs with compact fluorescents that were being given away at the supermarket, and Laurie’s new laptop has replaced the desktop PC, a new plasma TV has more than cancelled out the reductions. The display is still there on the fridge door, but when the batteries powering the display run out, and it goes blank, no-one notices.
The main point I’m trying to get across there is that with a very simple display, the possible feedback loop is very weak. It relies on the consumer experimenting with switching items on and off and seeing the effect it has on the readings, which – while it will initially have a certain degree of investigatory, exploratory interest – may well quickly pall when everyday life gets in the way. Now, without the kind of evidence that’s likely to come out of research programmes such as the CHARM project [10], it’s not possible to say whether levels (2) or (3) would fare any better, but giving a display the ability to provide more detailed levels of information – particularly if it can be updated remotely – massively increases the potential for effective use of the display to help consumers decide what to do, or even to think about what they’re doing in the first place, over the longer term.
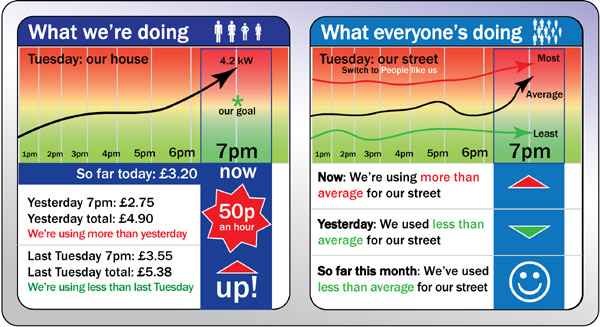
(2) Social / normative feedback on others’ energy use and costs
A level (2) display would (in a much less cluttered form than what I’ve drawn above!) combine information about ‘what we’re doing’ (self-monitoring) with a reference, a norm – what other people are doing (social proof), either people in the same neighbourhood (to facilitate community discussion), or a more representative comparison such as ‘other families like us’, e.g. people with the same number of children of roughly the same age, living in similar size houses. There are studies going back to the 1970s (e.g. [11, 12]) showing dramatic (2 × or 3 ×) differences in the amount of energy used by similar families living in identical homes, suggesting that the behavioural component of energy use can be significant. A display allowing this kind of comparison could help make consumers aware of their own standing in this context.
However, as Wesley Schultz et al [13] showed in California, this kind of feedback can lead to a ‘boomerang effect’, where people who are told they’re doing better than average then start to care less about their energy use, leading to it increasing back up to the norm. It’s important, then, that any display using this kind of feedback treats a norm as a goal to achieve only on the way down. Schultz et al went on to show that by using a smiley face to demonstrate social approval of what people had done – affective engagement – the boomerang effect can be mitigated.
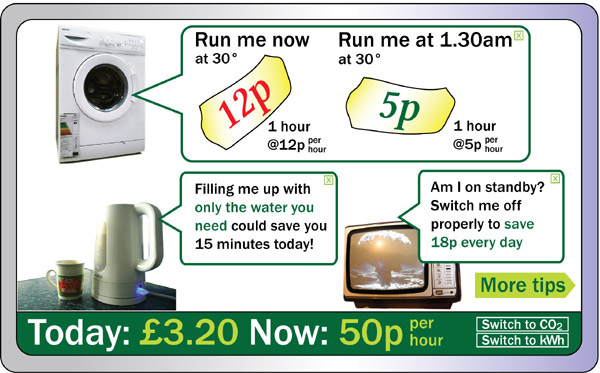
(3) Feedforward, giving information about the future impacts of behavioural decisions
A level (3) display would give consumers feedforward [14] – effectively, simulation of what the impact of their behaviour would be (switching on this device now rather than at a time when there’s a lower tariff – Economy 7 or a successor), and tips about how to use things more efficiently at the right moment (kairos), and in the right kind of environment, for them to be useful. Whereas ‘Tips of the Day’ in software frequently annoy users [15] because they get in the way of a user’s immediate task, with something relatively passive such as a smart meter display, this could be a more useful application for them. The networked capability of the smart meter means that the display could be updated frequently with new sets of tips, perhaps based on seasonal or weather conditions (“It’s going to be especially cold tonight – make sure you close all the curtains before you go to bed, and save 20p on heating”) or even special tariff changes for particular periods of high demand (“Everyone’s going to be putting the kettle on during the next ad break in [major event on TV]. If you’re making tea, do it now instead of in 10 minutes; time, and get a 50p discount on your next bill”).
Disaggregated data: identifying devices
This level (3) display doesn’t require any ability to know what devices a consumer has, or to be able to disaggregate electricity use by device. It can make general suggestions that, if not relevant, a consumer can ignore.
But what about actually disaggregating the data for particular devices? Surely this must be an aim for a really ‘smart’ meter display. Since [4, p.52] notes – in the context of discussing privacy – that “information from smart meters could… make it possible…to determine…to a degree, the types of technology that were being used in a property,” this information should clearly be offered to consumers themselves, if the electricity suppliers are going to do the analysis (I’ve done a bit of a possible mockup, using a more analogue dashboard style).
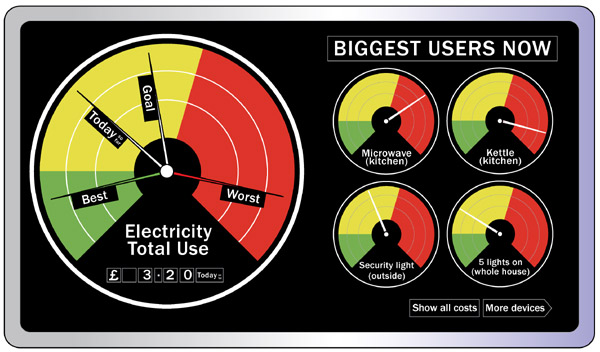
Whether the data are processed in the meter itself, or upstream at the supplier and then sent back down to individual displays, and whether the devices are identified from some kind of signature in their energy use patterns, or individual tags or extra plugs of some kind, are interesting technology questions, but from a consumer’s point of view (so long as privacy is respected), the mechanism perhaps doesn’t matter so much. Having the ability to see what device is using what amount of electricity, from a single display, would be very useful indeed. It removes the guesswork element.
Now, Sentec’s Coracle technology [16] is presumably ready for mainstream use, with an agreement signed with Onzo [17], and ISE’s signal-processing algorithms can identify devices down to the level of makes and models [18], so it’s quite likely that this kind of technology will be available for smart meters for consumers fairly soon. But the question is whether it will be something that all customers get – i.e. as a recommendation of the outcome of the DECC consultation – or an expensive ‘upgrade’. The fact that the consultation doesn’t mention disaggregation very much worries me slightly.
If disaggregated data by device were to be available for the mass-distributed displays, clearly this would significantly affect the interface design used: combining this with, say a level (2) type social proof display could – even if via a website rather than on the display itself – let a consumer compare how efficient particular models of electrical goods are in use, by using the information from other customers of the supplier.
In summary, for Q13 – and I’m aware I haven’t addressed the “energy use, money, CO2 etc” aspect directly – there are people much better qualified to do that – I feel that the more ability any display has to provide information of different kinds to consumers, the more opportunities there will be to do interesting and useful things with that information (and the data format and API must be open enough to allow this). In the absence of more definitive information about what kind of feedback has the most behaviour-influencing effect on what kind of consumer, in what context, and so on, it’s important that the display be as adaptable as possible.
Q14 Do you have comments regarding the accessibility of meters/display units for particular consumers (e.g. vulnerable consumers such as the disabled, partially sighted/blind)?
The inclusive design aspects of the meters and displays could be addressed through an exclusion audit, applying something such as the University of Cambridge’s Exclusion Calculator [19] to any proposed designs. Many solutions which would benefit particular consumers with special needs would also potentially be useful for the population as a whole – e.g. a buzzer or alarm signalling that a device has been left on overnight which isn’t normally, or (with disaggregation capability) notifying the consumer that, say, the fridge has been left open, would be pretty useful for everyone, not just the visually impaired or people with poor memory.
It seems clear that having open data formats and interfaces for any device will allow a wider range of things to be done with the data, many of which could be very useful for vulnerable users. Still, fundamental physical design questions about the device – how long the batteries last for, how easy they are to replace for someone with poor eyesight or arthritis, how heavy the unit is, whether it will break if dropped from hand height – will all have an impact on its overall accessibility (and usefulness).
Thinking of ‘particular consumers’ more generally, as the question asks, suggests a few other issues which need to be addressed:
– A website-only version of the display data (as suggested at points in the consultation document) would exclude a lot of consumers who are without internet access, without computer understanding, with only dial-up (metered) internet, or simply not motivated or interested enough to check – i.e., it would be significantly exclusionary.
– Time-of-Use (ToU) pricing will rely heavily on consumers actually understanding it, and what the implications are, and changing their behaviour in accordance. Simply charging consumers more automatically, without them having good enough feedback to understand what’s going on, only benefits electricity suppliers. If demand- or ToU-related pricing is introduced — “the potential for customer confusion… as a result of the greater range of energy tariffs and energy related information” [4, p. 49] is going to be significant. The design of the interface, and how the pricing structure works, is going to be extremely important here, and even so may still exclude a great many consumers who do not or cannot understand the structure.
– The ability to disable supply remotely [4, p. 12, p.20] will no doubt provoke significant reaction from consumers, quite apart from the terrible impact it will have on the most vulnerable consumers (the elderly, the very poor, and people for whom a reliable electricity supply is essential for medical reasons), regardless of whether they are at fault (i.e. non-payment) or not. There WILL inevitably be errors: there is no reason to suppose that they will not occur. Imagine the newspaper headlines when an elderly person dies from hypothermia. Disconnection may only occur in “certain well-defined circumstances” [3, p. 28] but these will need to be made very explicit.
– “Smart metering potentially offers scope for remote intervention… [which] could involve direct supplier or distribution company interface with equipment, such as refrigerators, within a property, overriding the control of the householder” [4, p. 52] – this simply offers further fuel for consumer distrust of the meter programme (rightly so, to be honest). As Darby [9] notes, “the prospect of ceding control over consumption does not appeal to all customers”. Again, this remote intervention, however well-regulated it might be supposed to be if actually implemented, will not be free from error. “Creating consumer confidence and awareness will be a key element of successfully delivering smart meters” [4, p.50] does not sit well with the realities of installing this kind of channel for remote disconnection or manipulation in consumers’ homes, and attempting to bury these issues by presenting the whole thing as entirely beneficial for consumers will be seen through by intelligent people very quickly indeed.
– Many consumers will simply not trust such new meters with any extra remote disconnection ability — it completely removes the human, the compassion, the potential to reason with a real person. Especially if the predicted energy saving to consumers is as low as 2.8% [4, p.18], many consumers will (perhaps rightly) conclude that the smart meter is being installed primarily for the benefit of the electricity company, and simply refuse to allow the contractors into their homes. Whether this will lead to a niche for a supplier which does not mandate installation of a meter – and whether this would be legal – are interesting questions.
Dan Lockton, Researcher, Design for Sustainable Behaviour
Cleaner Electronics Research Group, Brunel Design, Brunel University, London, June 2009
[1] Meadows, D. Leverage Points: Places to Intervene in a System. Sustainability Institute, 1999.
[2] DECC. Impact Assessment of smart / advanced meters roll out to small and medium businesses, May 2009.
[3] DECC. A Consultation on Smart Metering for Electricity and Gas, May 2009.
[4] DECC. Impact Assessment of a GB-wide smart meter roll out for the domestic sector, May 2009.
[5] Fischer, J. and Kestner, J. ‘Watt Watchers’, 2008.
[6] DOTT / live|work studio. ‘Low Carb Lane’, 2007.
[7] BERR. Impact Assessment of Smart Metering Roll Out for Domestic Consumers and for Small Businesses, April 2008.
[8] O’Leary, N. and Reynolds, R. ‘Current Cost: Observations and Thoughts from Interested Hackers’. Presentation at OpenTech 2008, London. July 2008.
[9] Darby S. The effectiveness of feedback on energy consumption. A review for DEFRA of the literature on metering, billing and direct displays. Environmental Change Institute, University of Oxford. April 2006.
[10] Kingston University, CHARM Project. 2009
[11] Socolow, R.H. Saving Energy in the Home: Princeton’s Experiments at Twin Rivers. Ballinger Publishing, Cambridge MA, 1978
[12] Winett, R.A., Neale, M.S., Williams, K.R., Yokley, J. and Kauder, H., 1979 ‘The effects of individual and group feedback on residential electricity consumption: three replications’. Journal of Environmental Systems, 8, p. 217-233.
[13] Schultz, P.W., Nolan, J.M., Cialdini, R.B., Goldstein, N.J. and Griskevicius, V., 2007.
‘The Constructive, Destructive and Reconstructive Power of Social Norms’. Psychological Science, 18 (5), p. 429-434.
[14] Djajadiningrat, T., Overbeeke, K. and Wensveen, S., 2002. ‘But how, Donald, tell us how?: on the creation of meaning in interaction design through feedforward and inherent feedback’. Proceedings of the 4th conference on Designing interactive systems: processes, practices, methods, and techniques. ACM Press, New York, p. 285-291.
[15] Business of Software discussion community (part of ‘Joel on Software’), ‘”Tip of the Day” on startup, value to the customer’, August 2006
[16] Sentec. ‘Coracle: a new level of information on energy consumption’, undated.
[17] Sentec. ‘Sentec and Onzo agree UK deal for home energy displays’, 28th April 2008
[18] ISE Intelligent Sustainable Energy, ‘Technology’, undated
[19] Engineering Design Centre, University of Cambridge. Inclusive Design Toolkit: Exclusion Calculator, 2007-8